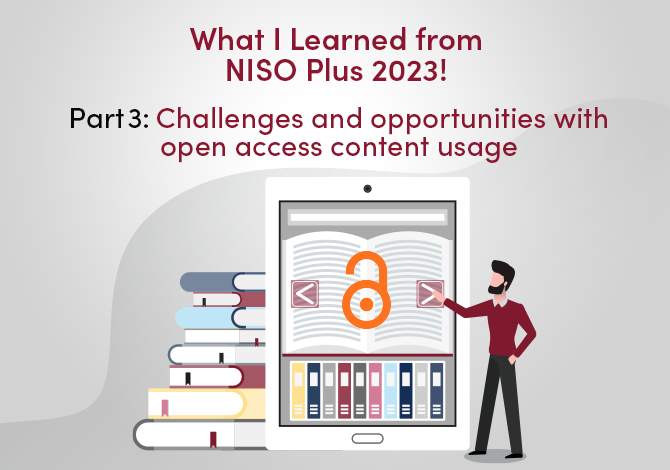
NISO Plus is an online conference hosted by the National Information Standards Organization, featuring presenters from all over the world, and from every part of the scholarly communications ecosystem. This is a three-day conference with multiple concurrent sessions spanning time zones and continents. In my blog post last week I examined three sessions on persistent identifiers (PIDs), covering topics such as the importance of PIDs in the scholarly infrastructure, specialization and governance of PIDs, and national strategies for the use of PIDs. In this final installment, I look at two sessions that focused on the challenges and opportunities with collecting and reporting on open access (OA) content usage, as well as some important work around standardizing OA content usage analytics.
There have been standard practices and well understood analytics in place for a long time for evaluating the reach and usage of scholarly content, particularly for subscription content. This is important because libraries and institutions want to understand how the resources they license are being utilized, and publishers and researchers want to understand who is using published research and where those constituents are located. The growing amount of OA content, for both books and journals, have created a hole in these analytics because there are few agreed upon processes for tracking and reporting on OA usage. This is especially true because access to OA content usually doesn’t require some form of registration or login, and they are not tracked by paywall mechanisms.
WHY WE WANT OA USAGE DATA
The first session, “Understanding the Value of Open Access Usage Information” brings together the perspectives of publishers, librarians, and technology providers, who discuss the issues they face measuring, understanding and sharing open access usage.
The first speaker, Kasia Repeta, an analyst working on global outreach and publishing systems at Duke University Press, identified that the key challenge is non-attributed usage. Unlike those who access subscription content, OA content users are not logged in and are counted as “anonymous visitors”. At Duke, 87% of OA usage was anonymous, and the result is that they know nothing about those users. Repeta points out that authors want to know the reach of their content, but this is difficult because it is hard to characterize the audience if they can’t get reliable data on the users’ institutions or organizations.
A second challenge that OA publishing presents is the lack of shared practices for evaluating usage statistics. For example, a flipped journal (a journal that does from subscription to OA) may experience an increase in readership, but this is not recognized because institutional registrations may decrease while non-attributed access increases. Because non-attributed access doesn’t have enough detail, the data is less useful. A third challenge is that open access data is inconsistent. There is inconsistent OA license tagging across publishers, inconsistent coverage of OA content in bibliographic database, and an inability to separate non-human traffic via web-crawlers from legitimate human access of content.
Repeta says what is needed is: a holistic view and tools for evaluating OA content and readership; agreement on what access data is valuable to libraries and how that data should be presented; and reliable, standards-based, technology-neutral workflows for measuring and exchanging of open access usage data.
The second presenter, Tasha Mellins-Cohen, project director at Project COUNTER, responded to these demands by discussing the new COUNTER 5.1 guidelines for reporting OA usage statistics. COUNTER has been the industry standard for usage metrics since 2003, and was originally created to ensure that content providers could give libraries consistent, verifiable and comparable usage data. Mellins-Cohen noted that COUNTER release 5.1, going live soon, optimizes delivery of OA reporting in 2 ways: Global Reporting and Item Reporting.
On global reporting, Mellins-Cohen reminded us that usage is either attributed or non-attributed, anything that can be linked to institutions is attributed, but an enormous amount of open access content is non-attributed. For subscription content, total usage is broken down by institution. For global reporting of open access no breakdown will be required, which means that usage of OA content can be reported without institutional breakdown. On item reporting, Mellins-Cohen points out that traditional COUNTER reporting uses title-level metrics, for example, journal title or book title. To be valuable for OA, usage needs to be more granular, since OA usage is more likely to be article and chapter oriented. COUNTER 5.1 provides guidance on more granular reporting.
An important message delivered by Mellins-Cohen is that usage is a missing measure of research impact. Historically, the industry has looked at citations when measuring impact, but citations are a lagging indicator. Another incomplete metric, Altmetrics, is more immediate, but it is indicative of fleeting attention, rather than impact. On the other hand, usage is an excellent factor for measuring impact because consistent, comparable usage statistics accrues from the day of publication, and reflects engagement with the original published content across time and geographic location. A major drawback is that OA usage metrics are still not reliable, since COUNTER reports are not aggregated across platforms, which means that content that appears on multiple platforms cannot get a comprehensive aggregated measurement.
A third speaker, Emily Poznanski, director of the Central European University Press, did a deeper dive into the difference between books and journals and why the OA usage metrics need to be evaluated differently. Books are delivered differently than journals. Journals usually have a single instance on a delivery platform, individual articles are fed up from that platform, and journals are measured by article usage. Whereas books can have multiple instances on different platforms, and books can be broken down into different components and are delivered in different ways, such as online, on PDF, or by chapters or other sections. Because of these differences, metrics for OA book usage across platforms is a major problem. The challenge of aggregating this diverse data is being tackled by a project called OA Book Usage Analytics for Diverse Communities, also known by its short title and acronym Book Analytics Dashboard (BAD). BAD is building an analytics dashboard infrastructure, it is implementing a long-term plan for housing and maintaining OA book, and it is creating a governance structure to oversee the project.
Poznanski also presented a case study on how OA has increased book usage. At the beginning of the COVID-19 pandemic, 279 titles were made open on Project MUSE from March to June in 2020. These books were downloaded 350,000 times from 129 countries, much more than previous download counts of these books when they were behind a paywall. Seven of the top ten downloads were for books over 10 years old, which shows that OA can bring new attention to older, but still relevant publications. Poznanski suggests that these usage numbers are not attainable without open access.
WHAT’S BEING DONE
The second session, “OA Usage Reporting: Understanding stakeholder needs and advancing trust through shared infrastructure” continues the OA usage conversation by bringing together individuals from an OA publisher, a research infrastructure organization, a usage data trust, and a usage analytics service provider, to discuss the complexities of the usage data collection, curation and distribution. They address questions like: What kind of usage data do diverse stakeholders need? What standards are required to ensure usage data is accurate? What infrastructure is needed to collect and disseminate this data effectively?
The first speaker, Tim Lloyd, CEO of LibLynx, a usage analytics provider, discussed the shortcomings of the current model for usage reporting. He pointed out that processes have been optimized for evaluating and reporting on paywalled content, but the amount of OA content is actually much greater than paywalled content. The assumptions are that usage data is collected and reported monthly, and that reprocessing of the data isn’t necessary. However, Lloyd feels that these old assumptions are too limiting, and that reporting requirements are becoming more frequent, and increasingly people want usage data on demand. He also notes that when new usage data becomes available later, it makes sense to reprocess old data to include the new information. These factors, plus the need for more granularity in usage data, as required by COUNTER 5.1, increases the volume of data and makes it more complex. The complexity doesn’t stop there. There are privacy concerns that need to be considered, and the COUNTER code of practice forbids the release of personally identifiable data or institution or consortia data (without permission).
Lloyd reviewed some of the strategies that need to be considered in order to deliver reliable, consistent and comparable OA usage data. Diverse file formats, new metadata fields and new use cases require new processes that accommodate differences in how and what gets reported. Users want more graphical formats for easier interpretation by diverse constituents, and they want greater frequency, like on demand reporting with real time analytics, custom date ranges, etc. In the OA world we know very little about the users, which means there need to be new processing strategies, such as IP address and the incorporation of third-party databases to facilitate the linking of PIDs to the respective metadata. Publishers are now syndicating content and distributing it via third party platforms, like ResearchGate and ScienceDirect, requiring the collection of aggregated content. Platforms want to provide bulk data delivery via APIs.
The second speaker, Tricia Miller, marketing manager at Annual Reviews, presented the publisher perspective. Annual Reviews has adopted the “Subscribe to Open” model, which means that they have a non-APC OA model, but they still require subscription revenue from some organizations to fund OA publishing. She points out that the increase in OA has changed their usage data, and that they must balance paywall and OA usage data, not look at the two types of usage in isolation. Aggregation of both subscription and open access usage data for their stakeholders, which includes libraries, authors and funders, is essential.
Miller discussed how OA usage is more wide-ranging than paywalled usage. Looking at their own usage statistics, she notes that OA has a global audience and a complex network of users. Their own OA usage data showed a 40% increase in first year, and in 2022 OA usage was 130% higher than paywalled usage. 90% of users are at academic institutions, but she notes that the variety of institutions is growing, which shows that there is a need for scholarly content beyond what paywalled content can reach. The audience is also more diverse for OA content. Global usage showed that 55 countries accessed Annual Reviews before it was OA, and in 2022, after going OA, that grew to 187 countries. They type of content accessed is also much more diverse.
Miller reviewed how all of this impacts stakeholders. There is a need for a collaborative framework that promotes data integrity, data availability, along with reproducibility and consistency. Open access usage interpretation looks at benefits to the community, and equity and access of the global audience. Accuracy of the data is important for trust, and so is sharing results and interpretations. More granular data means a balance of transparency and privacy. The problem of course is that OA data is still largely unattributed, which means usage data is inconsistent.
The third presenter, Christina Drummond, Executive Director of the OA Book Usage Data Trust, spoke about quality, completeness and timeliness of OA impact data. She started by talking about the OA Book Usage Data Trust, an initiative “to champion strategies for the improved publication and management of open-access books by exchanging reliable usage data in a trusted, equitable, and community-governed way”. The community principles and guidelines for interoperability and integration means that OA book stakeholders must freely and accurately exchange data. Much of the data needs to be aggregated from across platforms and other systems.
D’Urso described a Scholarly Communications Institute session from 2015, supported by Mellon Foundation, that focused on how to create an ecosystem and what kind of governance structure is required. Looking at some European frameworks, they saw a model for trusted data intermediation that facilitated data exchange across public organizations, non-profits, private and corporate entities. They came up with a data trust model to aggregate usage data, and agreed upon benchmarks that can be shared across the entities. They also integrated with the various PID authorities to ensure data interoperability.
Also discussed was the International Data Spaces Association (IDS). Because there are multiple organizations developing frameworks and standards related to exchange and processing of data, the IDS is working on creating a single authority to help bring these diverse interests together. There are two key concepts oriented around maintaining trust in the process and in ensuring systems and data quality. The IDS looks to leverage technology, finds ways to account for data provenance, and allow organizations to join or leave the ecosystem with their data. The IDS is hosting workshops to further their work, especially in the areas of governance, technical and security requirements, ethical guardrails, and compliance to ensure fair play. The desire is to be as open as possible, and as controlled as necessary.
The final speaker, Jennfer Kemp of Crossref, discussed the role of open infrastructure in capturing OA usage data. There are over 142 million Crossref records, of which 73% are journals, 16.4% are books, and 5.6% are conference proceedings. Preprints and peer review reports are a small but growing share. Kemp reminds us that usage information is not available in Crossref records, but the size of corpus means it is widely used as a way for discovery, and to connect research and other scholarly output to usage information.
Crossref metadata is heavily used by a wide variety of systems and tools. Registering content in Crossref is not just about getting a DOI, it is also about describing a scholarly work so that the information about that work is available to others, both machines and humans. The various systems in the scholarly ecosystem are increasingly connected, passing information and surfacing information, and if metadata is lacking, then communication about scholarly output will be lacking. For example, if a researcher is looking at a journal article with an underlying data set in a repository, the Crossref record can point the reader to both the article and the data set, as long as that information has been provided to Crossref, usually in the form of persistent identifiers.
Kemp also talked about the research nexus vision of more and better data, connecting individual records through relationships in the metadata. For example, connecting translations, versions of an article, preprints, etc. The research nexus shows the entire research landscape from funding through publications, to post publication discussion. It allows you to see a layered picture of usage and shows a complete picture of the impact and usage of the content.
It is clear from all of these sessions that open access usage data is an important part of the usage story, and that understanding how OA content is being used benefits the researcher, the publisher, the library and institution, and the funder. In addition, usage is a useful metric for evaluating the impact of science, since it is immediate and it is constant. However, the nature of open access is that content is freely available, which complicates the creation of the usage story because there are fewer access controls, which means we need to rely on incomplete data to tell the story. Fortunately, are several organizations and initiatives that are working toward standardizing and aggregating OA usage data, like Project COUNTER, Crossref, the Book Analytics Dashboard, the OA Book Usage Data Trust, the Scholarly Communications Institute, and the International Data Spaces Association.
Contact us today to know more about HighWire’s platforms and solutions. Read the first part of the blog here and the second part here.
By Tony Alves