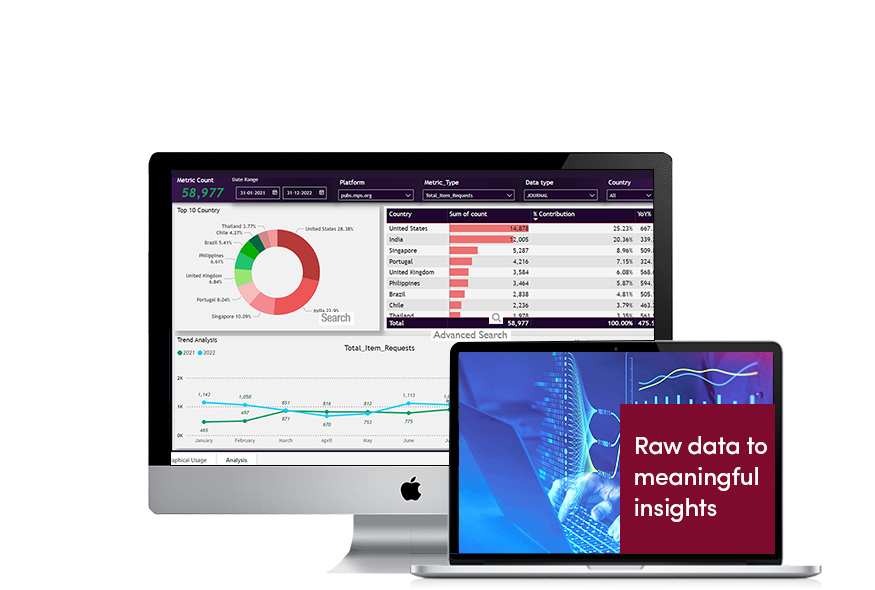
With Insight Vizor, teams can now generate content and institution usage dashboards easily. These reports can be filtered based on institutional segments, geographies, content types, and other parameters.
Visualization of monthly and yearly usage helps in making data-based decisions. For example, being able to see what content type garners the most interest drives decisions on what books to prioritize for revisions and for adding new content to, such as solution walkthroughs or videos.
For sales teams – the new cost per use dashboard gives an easy way to see how a customer is doing and to justify higher renewal increases for customers that have very low cost per use. Further, being able to pull lockout data for a time period helps identify potential leads and provides information that can be shared with those leads to help encourage them to subscribe.
Additional features from Insight Vizor that make it a leading choice for editors, customer success, sales, and marketing teams is listed below:
- Integration with COUNTER5
- Easy-to-analyze reports and visualizations
- Hosting platform agnostic
- Analytics dashboards providing detailed insight into site use
|
- Customizable according to your needs
- Content and institutional dashboards
- Monitor usage in different ways and over different time periods
- Data on Article usage, institution usage, demographies, sales leads
|